R语言-ggplot自定义点的形状汇总
一、ggpubr包
library(ggplot2)
library(ggpubr)

show_point_shapes() #显示点的形状(ggpubr包内的函数)
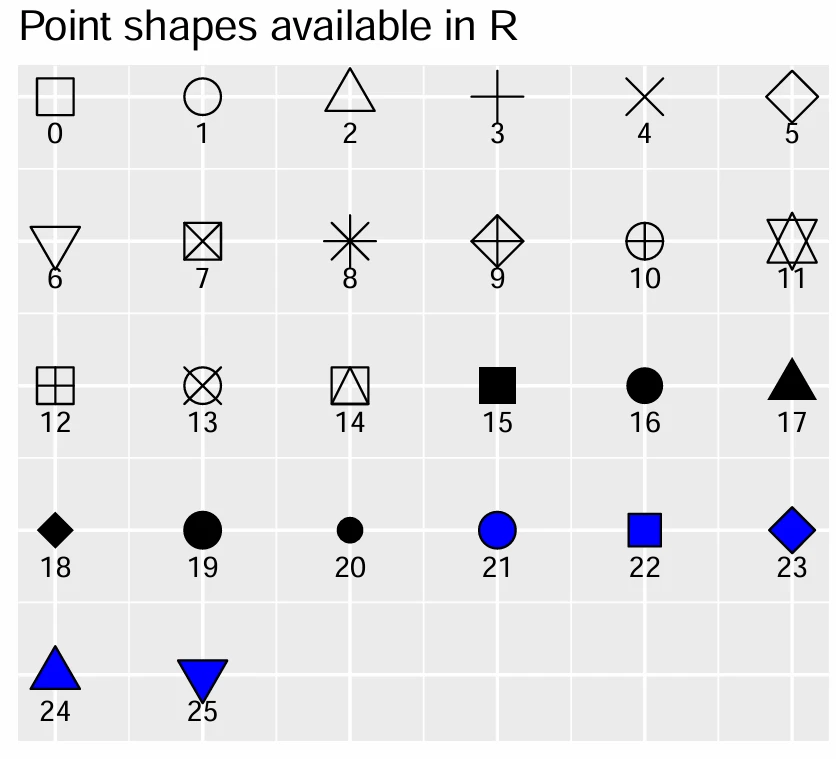
使用方法:
其中的形状21-25是可以设置填充颜色和描边颜色的,fill代表填充颜色,colour代表描边的颜色。可以设置为NA代表没有
# 随机生成数据
set.seed(123)
df <- data.frame(x = rnorm(30), y = rnorm(30))
# 使用不同形状绘制散点图
ggplot(df, aes(x = x, y = y)) +
    geom_point(shape = 21, size = 5, fill='red',colour = "black",stroke = 1)  # 使用形状21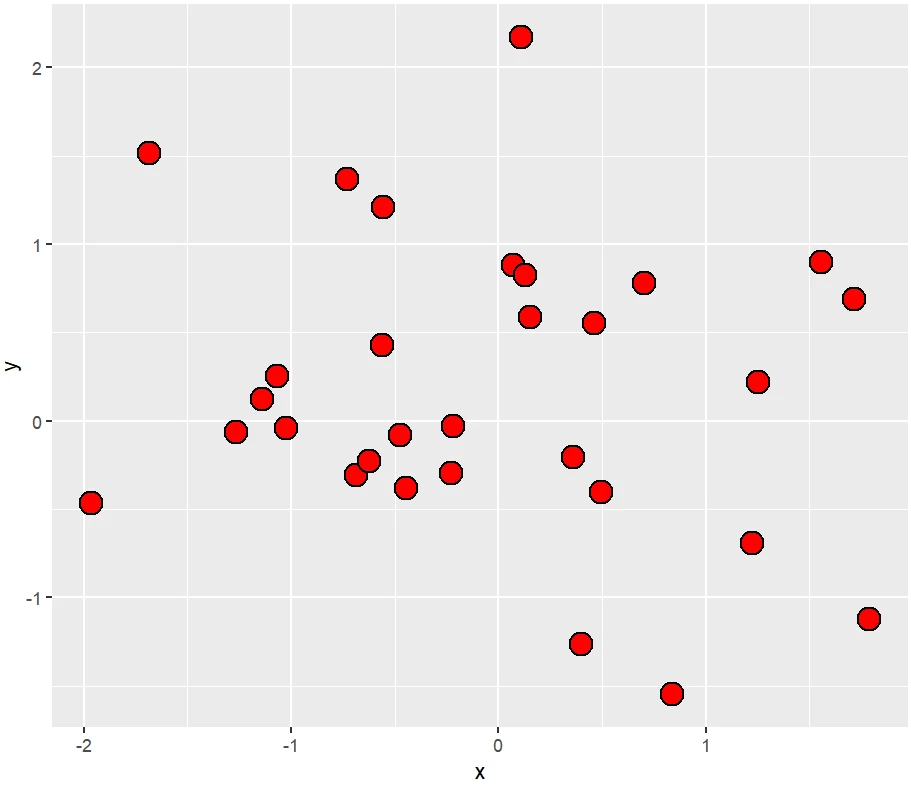
二、ggstar包
library(ggstar)
show_starshapes()
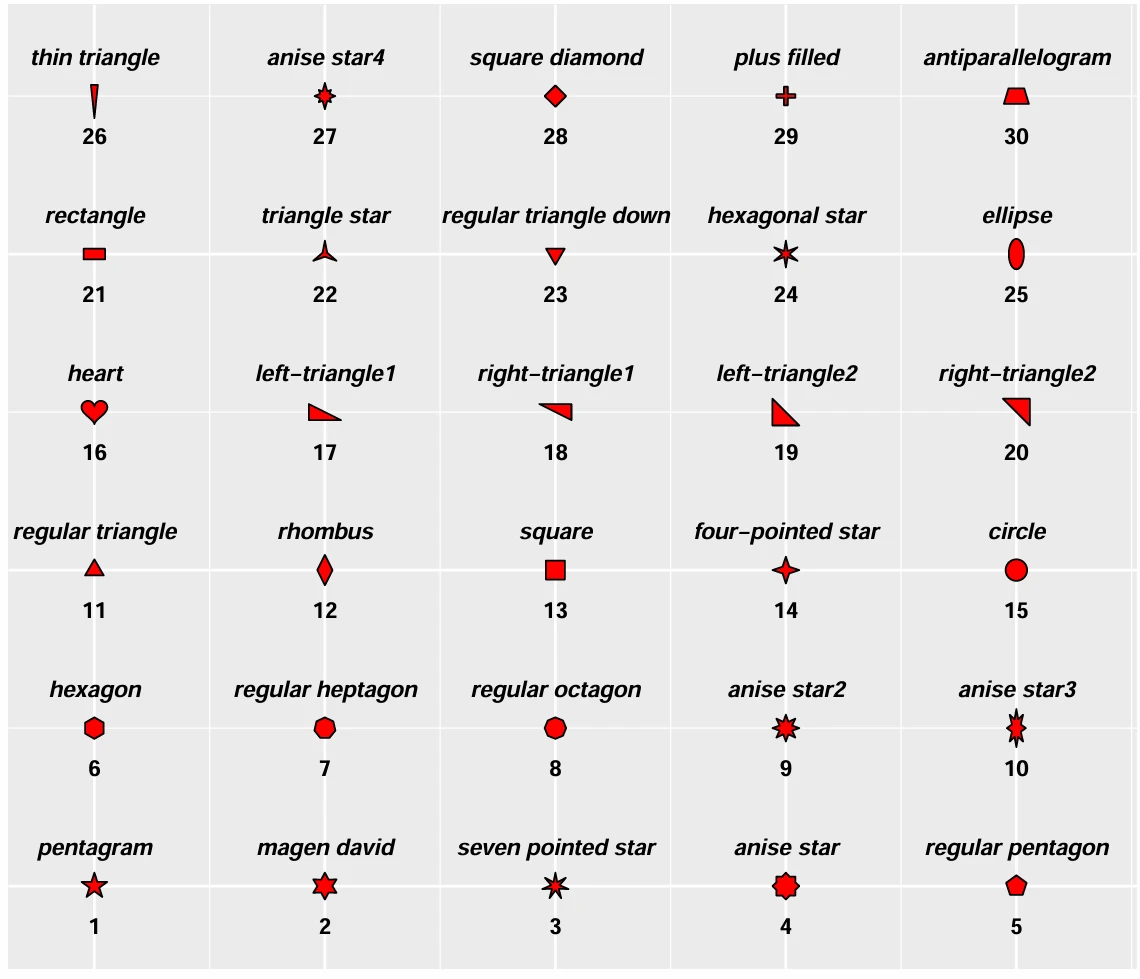
使用方法:
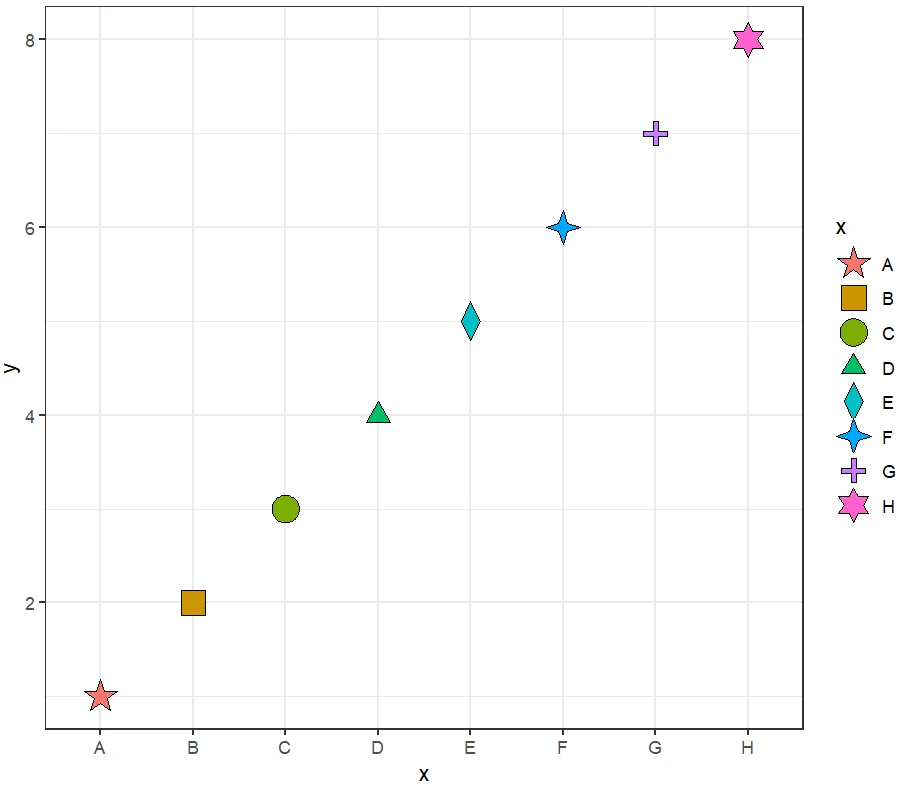
df <- data.frame(x = LETTERS[1:8], y = 1:8)
ggplot() +
    geom_star(data = df, aes(x = x, y = y, starshape = x, fill = x), size = 5) +
    theme_bw()
THE END

R-4.4.1及R-studio保姆级安装配置详细教程及常见问题解答
前言
我不生产知识,我只是知识的搬运工,以下内容是源于 CSDN - 数模加油站 的安装教程:最新R(4.4.1)及R-studio保姆级安装配置详细教程及常见问题解答
个……

R语言中导出包内置数据集
前言
在数据分析和研究过程中,常常需要将R包中的内置数据集导出为外部文件,以便进行进一步的分析、共享或存档。本文将详细介绍如何在R中使用microeco包和ope……

OTU/ASV表抽平
1 抽平是什么?
抽平:指按照一定数量或样本序列最低数量,将所有样本的序列随机抽取至统一数据量。
简单地说,就是在不同的样本测序数据有差距的时候,保证样……
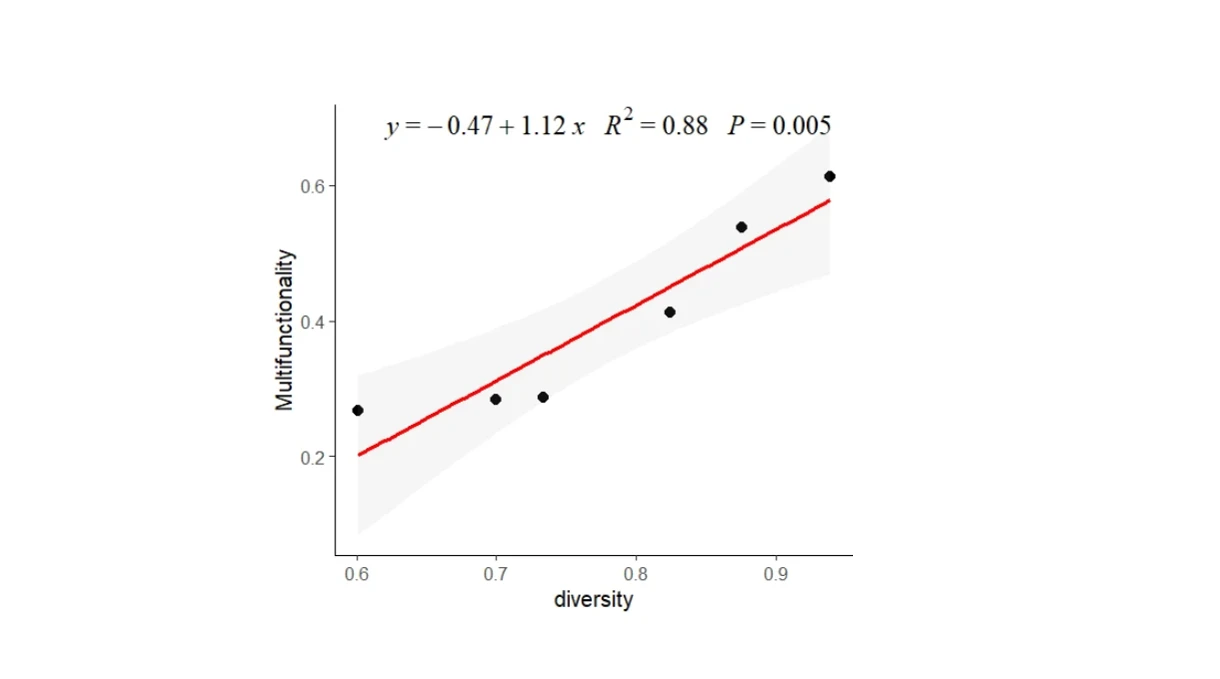
散点拟合作图
数据格式:
代码:
library(openxlsx)
library(ggplot2)
library(ggpmisc)
dat = read.xlsx("./散点拟合数据.xlsx",
sheet = 1,)
……